Traffic Fatalities
29 November 2013 - Kev Kirkland

We ran an Open Data workshop in Bristol yesterday. The day was kindly hosted by the Pervasive Media Studio in Watershed with attendees from Environment Agency, Apache Foundation, ODI as well as local charities from England and Wales. Thanks to the people who attended for the stimulating discussions.
Ian Coles from Sustrans suggested we look at some of the Department for Transport figures on data.gov.uk. We searched for data in CSV format which led us to one result - Reported fatal personal injury road accident and casualty data: GB 2006-2008. Unfortunately the data link seems to be down, but following the archive links got us to some data from 2011 here.
We choose the file labelled Feb 04 2011. Visualising the data in Data Unity gives us the following views on road accidents (each segment represents a one hour time slot showing the proportion of deaths in that hour):
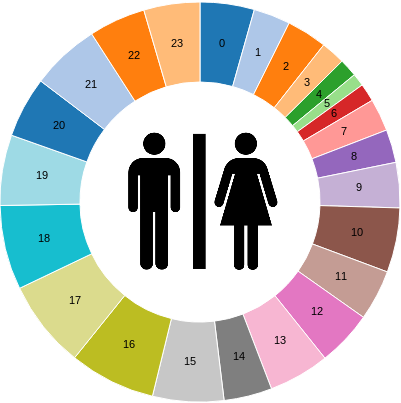 *Pedestrian fatalities by hour of the day*
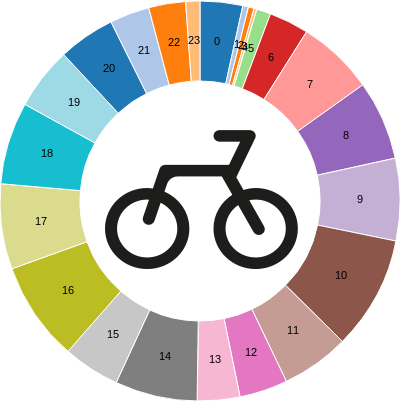 *Cycling fatalities by hour of the day*
A quick look at the charts show us that there are different patterns for fatalities for pedestrians and cyclists:
- It seems cyclists die more in daylight hours, whereas a significant proportion of pedestrian deaths happen throughout the night. Given the numbers of pedestrians dying at night, possibly alchol is a leading cause (drink driving or ‘drink walking’).
- There seems to be more pedestrian deaths in evening peak times, than morning peak times, but the morning/evening balance is more even amoungst cyclists.
It’s pretty sobering looking at figures which represents deaths, but by finding patterns we can raise awareness and get pointers to solutions to bring those fatalities down.
You can keep up to date with the latest developments for Data Unity by signing up to the newsletter on our home page.
Cycle icon from minicons licensed under creative commons.